Monitoring, Measuring, and Learning for Continuous Improvement
It is a very exciting time to be in technology! I think most of us are attracted to this industry because we love to play with cool new things. This technology could range from entertaining gadgets/hardware to new software, but this also means we have to be adaptive. Those who can’t adapt may be able to survive, but those that can will thrive.
When you think about adapting in terms of application development and operations, the high-level process is pretty intuitive. Monitoring and monitoring are just the acts of capturing raw bits of information about your application and the environment it resides in. The analysis and learning are when you take that raw data and transform it into something that can be used to improve an aspect of your application.
When you implement changes based on what you learned from your monitors, you can expect to see payback based on one or more of the following:
- A reduction in mean time to detect problems
- A reduction in mean time to resolve (MTtR) problems
- Improved success in achieving business goals
Azure Management Portal
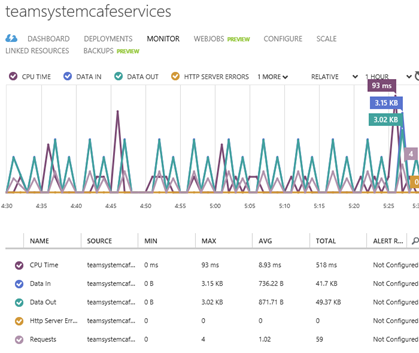
Your virtual machine DASHBOARD and MONITOR tabs will show you the CPU usage, disk read bytes/second, disk write bytes/sec, incoming network traffic, and outgoing network traffic. Your Azure Web Sites provide slightly different, but very similar metrics and the screenshot of my application’s metrics are below.
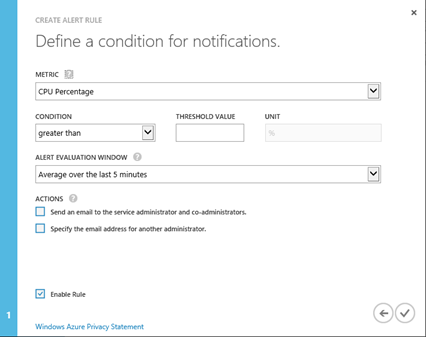
You can also set up email alerts using the Azure Management Portal based on a metric that exceeds a selected threshold. This is done through the Management Services option in the navigation pane of the portal.
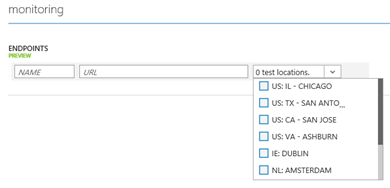
The above dashboard metrics don’t require any additional work on your part – they’re on by default. In addition, on the Configure tab of a Web Site or Virtual Machine, you can set up Endpoint Monitoring. This allows you to test one or more URLs from any of our Azure data centers across the planet. Azure Web Sites can only use Endpoint Monitoring if they are in either Basic or Standard mode.
Application Insights
Application Insights is a new service under the Visual Studio Online umbrella of services and it provides all kinds of rich monitoring features. It’s currently in public preview, so anyone can check it out. While you don’t need to store code in Visual Studio Online to use the service, but you do need a Visual Studio Online account.
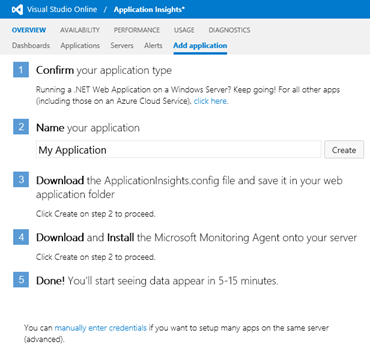
Configure an application
If your application is already deployed on a server, you only need to do the following to get started:
- Download ApplicationInsights.config from your Application Insights portal. This configuration file contains everything you need to connect your application to the Application Insights service. You can modify some additional settings as well.
- Download and install Microsoft Monitoring Agent on the server. Right now, there’s a pre-release version of the agent that you should download from the Application Insights portal. Eventually, the same agent can be used to send data to Application Insights or System Center. (If you already have the System Center agent installed, you’ll have to uninstall it to utilize this new agent.)
|
Special note: We are working to remove the dependency on the agent as much as possible, so that you don’t need that separate install. Ideally, the necessary telemetry components just ride along with your application. |
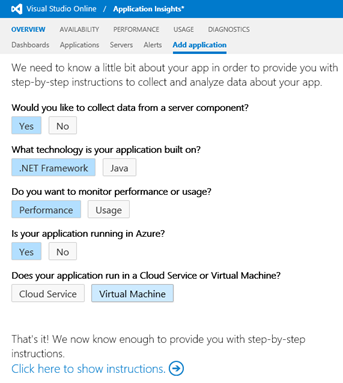
If you are creating or editing an application in Visual Studio, you can follow these steps to connect to Application Insights:
- If you have Visual Studio 2013, you can download and install Application Insights Tools for Visual Studio from here. Older versions of Visual Studio will lack some of the new integration, but you can just add the desired Application Insights components from NuGet.
-
If you have an existing Visual Studio project, you can then right-click the project and select Add Application Insights Telemetry to Project…
- Confirm the selected Visual Studio Online account
- Click Configure settings to change the name of the container you want to upload telemetry to.
- Developers can also opt-in to Application Insights right when they create a Visual Studio project.
- In any case, you should still consider downloading the Microsoft Monitoring Agent to get the full set of telemetry.
|
Special note: For Azure PaaS web and worker roles, you have to modify cscfg and add startup task. Azure Web Sites are not yet supported with Application Insights. |
What can we monitor/measure?
Application Insights currently supports the following application types: .NET Web Applications (sites or services), Java web applications, Windows Store and Windows Phone Apps. Supported platform list currently includes Tomcat 5, 6, or 7, JBoss 6, Windows Server 2008 or 2012, and Linux (CentOS, Red Hat, Ubuntu).
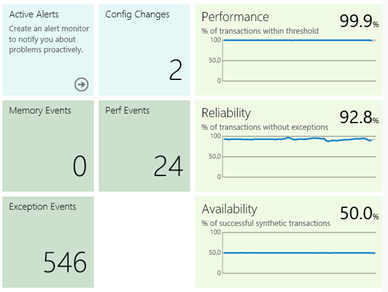
From the OVERVIEW tab, you can see a list your monitored applications and some average stats. Each of these applications is really a container where you send data. For example, you may have the same application installed on several servers in a web farm, but you want to treat the farm as one application. You can view a list of monitored servers which also displays agent version, OS version, and the last reported “heartbeat”.
Alerts was very recently redesigned to provide a more comprehensive experience. You can set up alerts for availability or specific metric threshold violations. The Alerts page displays a rich alert history.
You can set up dashboards with the metrics you care about most. You can even have multiple dashboards focusing on different metrics. Created dashboards can be private or shared with others.
How do we use this to learn and improve?
Availability
The easiest thing to set up is availability tests. There is no code required and you can test a web application built on any platform.
To set this up, you need to create a synthetic monitor – either a Single URL or a Multistep Web Test. In some cases, directly hitting a URL with the Single URL synthetic test is all you need. A good example would be checking on your home page. In other cases, verifying availability can be a bit more complex. Let’s say I don’t consider my application available unless I’m confident users can find and add items to their virtual cart, and maybe even place the order. In order to do this, I need a sequence of steps, so the Multistep Web Test allows me to upload Visual Studio Web Performance Tests.
These are called “synthetic” because they are not activity from real users. This is important to understand. Your actual user activity could still be failing, but we’ll come back to that in just a bit.
Tracking availability is done by using one of our 16 Azure data centers scattered across the planet. By running the tests from these various locations, you can get a sense of how responsive your app is to users near those locations.
Each green dot or red x indicates the result of a synthetic monitor. You can click into a failed multistep test to see the individual steps and even download the test result into Visual Studio for further analysis by developers if necessary.
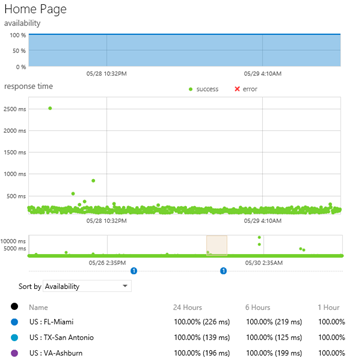
One of my favorite features is the subtle dots just below the timeline. Whenever you see these, they indicate a change that could explain why your metrics suddenly differ. Blue dots indicate a deployment and green dots indicate a change to how you have configured your monitors. To get this information, you should use TFS to publish build information as part of your automated build.
Usage
There are three usage-related sections: Features, Users, and Environment.
The Features and Users sections track who and how users are consuming your application. We can track the active users/sessions/activities per day and we can track how long before known users return to the application.
If you are using the Visual Studio extension, you’re web site’s pages are already being tracked. You can insert the necessary JavaScript yourself as well by pulling it from the Application Insights portal. You can either paste the JavaScript into select pages or just drop it into your master page(s).
For many apps, you should consider logging authenticated users. If you do not, the service can’t know that the same user has just logged in using different browsers or devices and, therefore, will be counted as a different user in each case.
|
appInsights.start(“your app’s component ID”); appInsights.appUserId = someUserIdentifier; appInsights.accountId = someUserAccount; appInsights.logPageView(); |
If you want to log your own custom events from the user’s browser, add the following code. You’ll see these events on the Usage | Features | Events page. Note the option to create an event hierarchy so you can aggregate values. In this example, I’ll be able to see what items users are adding to my cart, but I could also just look at any cart activity.
|
if (appInsights) { appInsights.logEvent(“cart/add”, // a hierarchical event of your choosing { Item : “notebook”, DiscountCode : “0” }, // any number of string key/value pairs { Quantity : 3 } ); // only allowed one numeric measure } |
In addition to the above usage data, we can also track a bit about the user’s environment. Which operating systems or browsers are users using? Their screen resolution may give you hints about the size or quality of the devices. Where are your users located in the world and what language are they using to hit your application?
Performance
In order to collect performance data, you need to have installed and configured the Microsoft Monitoring Agent.
Obviously, we’ll give you the metrics for CPU, memory usage, and network I/O. We’ll also provide the ever-popular number of exceptions thrown per second! (YUCK!)
When we are monitoring performance of a web application, two particular metrics are critical: request rate and response time. We’ll give you a list of the top 10 slowest requests by issue count. There’s a chart showing response time distribution, so you can quickly see if you have a lot of latency issues, but my favorite chart is the Response Time and Load vs Dependencies. On this graph, not only do we see request rate and response time overlaid, but there are various bars indicating the time spent awaiting calls to our application’s dependencies. These dependencies are automatically discovered by the Microsoft Monitoring Agent and may include calls to my application’s databases or to third-party web services. When you see those long response times at certain times of the day and you’ve been hard-pressed they were due to calls your stock quote service, now you’ll have some evidence. J
By default, if your application exceeds 90% of the maximum memory allowed within IIS or more than 50% of the machine’s physical memory, a memory event will be raised. If you open the details of this event, you can download a pair of memory dumps for analysis within Visual Studio 2013 Ultimate. One of the memory dumps is taken at the time of the problem and the other is a bit older, so you can compare the two.
Diagnostics
The last major tab in Application Insights is the DIAGNOSTICS tab. And while I hope you never have to go there, I figured I should tell you a little about it. It is itself divided into four sub-tabs: Metrics, Events, Streaming Data, and Search.
The Metrics section allows you to overlay any number of performance counters. Select the desired metrics to appear on your chart and configure any alerts for any of these counters.
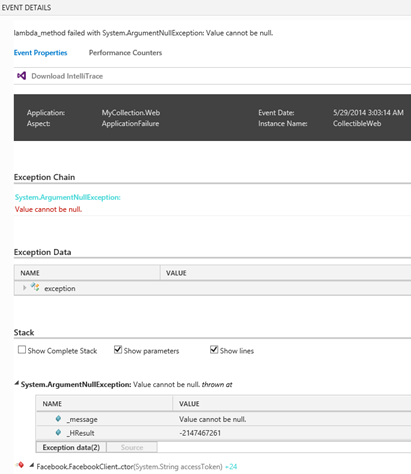
Events are recorded when metrics exceed a particular threshold or an exception is identified. You can double-click to open an event’s details. You may want to dive into the exception data or the call stack. If it’s a sneaky little exception, you can even download an IntelliTrace file so you can step through the application’s code as if you were running the Visual Studio debugger on the remote machine back when the event occurred!
Streaming Data is just used when running your application from Visual Studio. We can post events to Application Insights from Visual Studio that may assist you while you are developing/debugging/troubleshooting.
If you are using logging to record events, the Search tab can be used to search through your logs across all of your application’s servers. There’s some keywords and special punctuation to improve your search results. Check out this article to learn more about searching diagnostic logs.
I’ve found it helpful to use the following PowerShell scripts to control the monitoring of my applications. There are a small, but important set of parameters for these commands and you can read a bit more about them here.
|
Get-WebApplicationMonitoringStatus Start-WebApplicationMonitoring –Cloud “Default Web Site” –OutputPath outputfolder –Mode Trace Checkpoint-WebApplicationMonitoring // saves a log file Stop-WebApplicationMonitoring –Local -All |
Summary
This post was intended to make you aware of a couple of means of monitoring your application: built-in Azure monitoring and the more comprehensive Application Insights. It can often be difficult to know what data to log and pay attention to, but we hope that these options make that a little bit easier and less stressful.
One final note: Monitoring isn’t limited to production, but it should also be used in dev and QA environments. You may use slightly different settings, but you should be identifying problems before they get all the way to production. It also helps to get comfortable with these metrics while you are in development and not just at the stressful time of a production issue!
Additional Resources
Posted on June 1, 2014, in Uncategorized. Bookmark the permalink. Leave a comment.

Leave a comment
Comments 0