An Intro to “TestOps”?
 http://stlsilverlinings.org |
A few of my co-workers and I were just talking about testing trends and I was recently directed to Seth Eliot’s blog (here) by another colleague. Seth is currently at Amazon and he was at Microsoft for approximately six years in various test management and test lead roles. His work experience is noteworthy because he’s been working for very large organizations that deliver software at a rapid pace. He’s put into words the thoughts I’ve been muddling around on for the last five years.
It’s an interesting time for QA individuals. Due to several factors, their world might be a lot different than it has been in previous years. This is the first post in a short series of blog posts on the topic of testing trends. This first post will just lay some groundwork. Subsequent posts will go deeper and offer up possible solutions.
I used to work on a development team at a large organization that would take six to eight weeks to document and refine 75-pages of requirements. They’d then hand these over to the development teams who would write code for three to six months. Although the developers would do some unit testing and even some functional testing in a dev environment, they would depend on a sizable QA team to validate that the build was meeting expectations. This QA effort would take another two to four months. Altogether, that’s between seven and ten months to get this project out the door and into users’ hands.
In this world, QA had weeks or months to write manual test cases and execute them, but it was rarely enough time to test the new functionality and fully regression test the application.
Enter Agile!
The popularity of agile has definitely surpassed critical mass! Enterprise development teams NOT incorporating several agile practices are now the exception. This often means development teams are reducing their release cycles from months (years?!) down to four weeks or even days. This provides tremendous business value as stakeholders get to see their most-valued requirements implemented and working in a dev environment faster than ever.
Unfortunately, the pervasiveness of agile has been limited to those writing code and not to the greater set of people involved in the software development process. Shortening your release cycle to two weeks doesn’t do you much good if QA requires weeks/months to run their tests. The bottleneck has now shifted from developers over to QA to get what developers are showing to stakeholders out the door and into the hands of end-users! (This same pressure applies to Ops, but that’s a different blog series.)
I’ll dive into these topics in future posts, but let me give you a teaser on some of my thoughts…
- Move QA earlier in the cycle
- Reduce your dependence on manual tests
- Increase your dependence on unit tests
- Ask yourself how your automated functional testing is going
- Learn more from production
Would you like to discus these topics in person? Come join us at the St. Louis Silver Linings Conference on Oct 30. Admission is just $30 for a whole day of breakout sessions on DevOps, the cloud, and more!
|
http://stlsilverlinings.org |
Monitoring, Measuring, and Learning for Continuous Improvement
It is a very exciting time to be in technology! I think most of us are attracted to this industry because we love to play with cool new things. This technology could range from entertaining gadgets/hardware to new software, but this also means we have to be adaptive. Those who can’t adapt may be able to survive, but those that can will thrive.
When you think about adapting in terms of application development and operations, the high-level process is pretty intuitive. Monitoring and monitoring are just the acts of capturing raw bits of information about your application and the environment it resides in. The analysis and learning are when you take that raw data and transform it into something that can be used to improve an aspect of your application.
When you implement changes based on what you learned from your monitors, you can expect to see payback based on one or more of the following:
- A reduction in mean time to detect problems
- A reduction in mean time to resolve (MTtR) problems
- Improved success in achieving business goals
Azure Management Portal
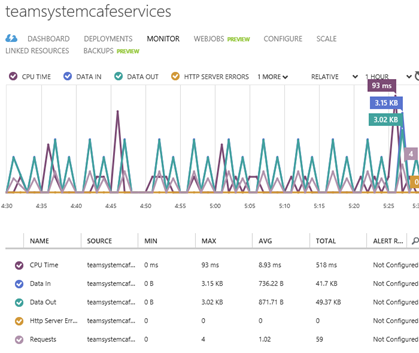
Your virtual machine DASHBOARD and MONITOR tabs will show you the CPU usage, disk read bytes/second, disk write bytes/sec, incoming network traffic, and outgoing network traffic. Your Azure Web Sites provide slightly different, but very similar metrics and the screenshot of my application’s metrics are below.
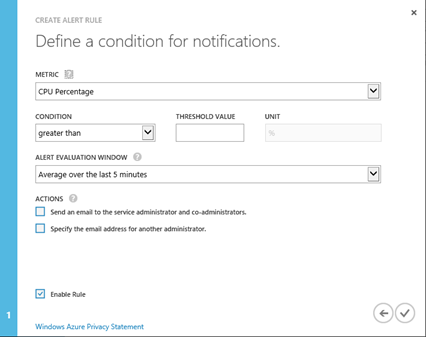
You can also set up email alerts using the Azure Management Portal based on a metric that exceeds a selected threshold. This is done through the Management Services option in the navigation pane of the portal.
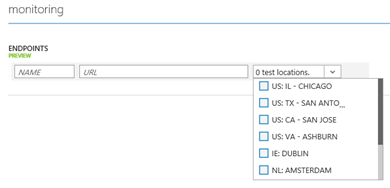
The above dashboard metrics don’t require any additional work on your part – they’re on by default. In addition, on the Configure tab of a Web Site or Virtual Machine, you can set up Endpoint Monitoring. This allows you to test one or more URLs from any of our Azure data centers across the planet. Azure Web Sites can only use Endpoint Monitoring if they are in either Basic or Standard mode.
Application Insights
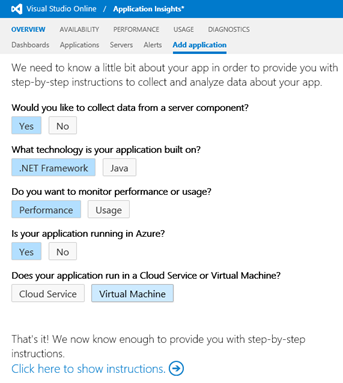
Application Insights is a new service under the Visual Studio Online umbrella of services and it provides all kinds of rich monitoring features. It’s currently in public preview, so anyone can check it out. While you don’t need to store code in Visual Studio Online to use the service, but you do need a Visual Studio Online account.
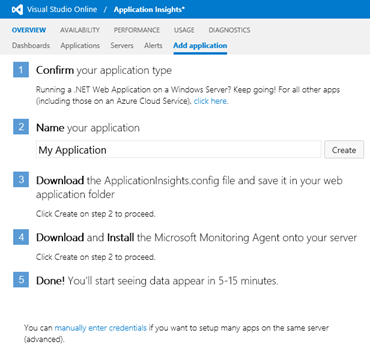
Configure an application
If your application is already deployed on a server, you only need to do the following to get started:
- Download ApplicationInsights.config from your Application Insights portal. This configuration file contains everything you need to connect your application to the Application Insights service. You can modify some additional settings as well.
- Download and install Microsoft Monitoring Agent on the server. Right now, there’s a pre-release version of the agent that you should download from the Application Insights portal. Eventually, the same agent can be used to send data to Application Insights or System Center. (If you already have the System Center agent installed, you’ll have to uninstall it to utilize this new agent.)
|
Special note: We are working to remove the dependency on the agent as much as possible, so that you don’t need that separate install. Ideally, the necessary telemetry components just ride along with your application. |
If you are creating or editing an application in Visual Studio, you can follow these steps to connect to Application Insights:
- If you have Visual Studio 2013, you can download and install Application Insights Tools for Visual Studio from here. Older versions of Visual Studio will lack some of the new integration, but you can just add the desired Application Insights components from NuGet.
-
If you have an existing Visual Studio project, you can then right-click the project and select Add Application Insights Telemetry to Project…
- Confirm the selected Visual Studio Online account
- Click Configure settings to change the name of the container you want to upload telemetry to.
- Developers can also opt-in to Application Insights right when they create a Visual Studio project.
- In any case, you should still consider downloading the Microsoft Monitoring Agent to get the full set of telemetry.
|
Special note: For Azure PaaS web and worker roles, you have to modify cscfg and add startup task. Azure Web Sites are not yet supported with Application Insights. |
What can we monitor/measure?
Application Insights currently supports the following application types: .NET Web Applications (sites or services), Java web applications, Windows Store and Windows Phone Apps. Supported platform list currently includes Tomcat 5, 6, or 7, JBoss 6, Windows Server 2008 or 2012, and Linux (CentOS, Red Hat, Ubuntu).
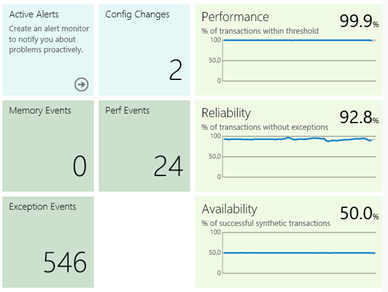
From the OVERVIEW tab, you can see a list your monitored applications and some average stats. Each of these applications is really a container where you send data. For example, you may have the same application installed on several servers in a web farm, but you want to treat the farm as one application. You can view a list of monitored servers which also displays agent version, OS version, and the last reported “heartbeat”.
Alerts was very recently redesigned to provide a more comprehensive experience. You can set up alerts for availability or specific metric threshold violations. The Alerts page displays a rich alert history.
You can set up dashboards with the metrics you care about most. You can even have multiple dashboards focusing on different metrics. Created dashboards can be private or shared with others.
How do we use this to learn and improve?
Availability
The easiest thing to set up is availability tests. There is no code required and you can test a web application built on any platform.
To set this up, you need to create a synthetic monitor – either a Single URL or a Multistep Web Test. In some cases, directly hitting a URL with the Single URL synthetic test is all you need. A good example would be checking on your home page. In other cases, verifying availability can be a bit more complex. Let’s say I don’t consider my application available unless I’m confident users can find and add items to their virtual cart, and maybe even place the order. In order to do this, I need a sequence of steps, so the Multistep Web Test allows me to upload Visual Studio Web Performance Tests.
These are called “synthetic” because they are not activity from real users. This is important to understand. Your actual user activity could still be failing, but we’ll come back to that in just a bit.
Tracking availability is done by using one of our 16 Azure data centers scattered across the planet. By running the tests from these various locations, you can get a sense of how responsive your app is to users near those locations.
Each green dot or red x indicates the result of a synthetic monitor. You can click into a failed multistep test to see the individual steps and even download the test result into Visual Studio for further analysis by developers if necessary.
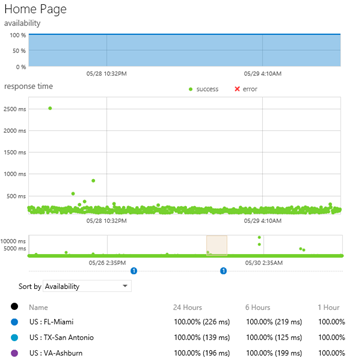
One of my favorite features is the subtle dots just below the timeline. Whenever you see these, they indicate a change that could explain why your metrics suddenly differ. Blue dots indicate a deployment and green dots indicate a change to how you have configured your monitors. To get this information, you should use TFS to publish build information as part of your automated build.
Usage
There are three usage-related sections: Features, Users, and Environment.
The Features and Users sections track who and how users are consuming your application. We can track the active users/sessions/activities per day and we can track how long before known users return to the application.
If you are using the Visual Studio extension, you’re web site’s pages are already being tracked. You can insert the necessary JavaScript yourself as well by pulling it from the Application Insights portal. You can either paste the JavaScript into select pages or just drop it into your master page(s).
For many apps, you should consider logging authenticated users. If you do not, the service can’t know that the same user has just logged in using different browsers or devices and, therefore, will be counted as a different user in each case.
|
appInsights.start(“your app’s component ID”); appInsights.appUserId = someUserIdentifier; appInsights.accountId = someUserAccount; appInsights.logPageView(); |
If you want to log your own custom events from the user’s browser, add the following code. You’ll see these events on the Usage | Features | Events page. Note the option to create an event hierarchy so you can aggregate values. In this example, I’ll be able to see what items users are adding to my cart, but I could also just look at any cart activity.
|
if (appInsights) { appInsights.logEvent(“cart/add”, // a hierarchical event of your choosing { Item : “notebook”, DiscountCode : “0” }, // any number of string key/value pairs { Quantity : 3 } ); // only allowed one numeric measure } |
In addition to the above usage data, we can also track a bit about the user’s environment. Which operating systems or browsers are users using? Their screen resolution may give you hints about the size or quality of the devices. Where are your users located in the world and what language are they using to hit your application?
Performance
In order to collect performance data, you need to have installed and configured the Microsoft Monitoring Agent.
Obviously, we’ll give you the metrics for CPU, memory usage, and network I/O. We’ll also provide the ever-popular number of exceptions thrown per second! (YUCK!)
When we are monitoring performance of a web application, two particular metrics are critical: request rate and response time. We’ll give you a list of the top 10 slowest requests by issue count. There’s a chart showing response time distribution, so you can quickly see if you have a lot of latency issues, but my favorite chart is the Response Time and Load vs Dependencies. On this graph, not only do we see request rate and response time overlaid, but there are various bars indicating the time spent awaiting calls to our application’s dependencies. These dependencies are automatically discovered by the Microsoft Monitoring Agent and may include calls to my application’s databases or to third-party web services. When you see those long response times at certain times of the day and you’ve been hard-pressed they were due to calls your stock quote service, now you’ll have some evidence. J
By default, if your application exceeds 90% of the maximum memory allowed within IIS or more than 50% of the machine’s physical memory, a memory event will be raised. If you open the details of this event, you can download a pair of memory dumps for analysis within Visual Studio 2013 Ultimate. One of the memory dumps is taken at the time of the problem and the other is a bit older, so you can compare the two.
Diagnostics
The last major tab in Application Insights is the DIAGNOSTICS tab. And while I hope you never have to go there, I figured I should tell you a little about it. It is itself divided into four sub-tabs: Metrics, Events, Streaming Data, and Search.
The Metrics section allows you to overlay any number of performance counters. Select the desired metrics to appear on your chart and configure any alerts for any of these counters.
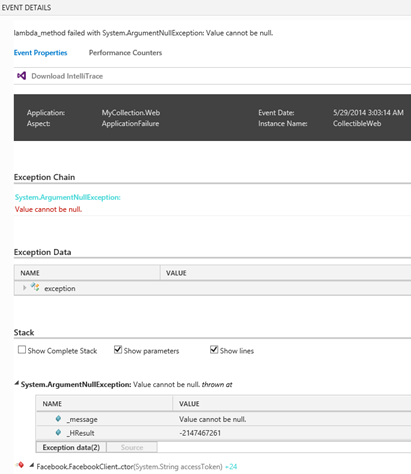
Events are recorded when metrics exceed a particular threshold or an exception is identified. You can double-click to open an event’s details. You may want to dive into the exception data or the call stack. If it’s a sneaky little exception, you can even download an IntelliTrace file so you can step through the application’s code as if you were running the Visual Studio debugger on the remote machine back when the event occurred!
Streaming Data is just used when running your application from Visual Studio. We can post events to Application Insights from Visual Studio that may assist you while you are developing/debugging/troubleshooting.
If you are using logging to record events, the Search tab can be used to search through your logs across all of your application’s servers. There’s some keywords and special punctuation to improve your search results. Check out this article to learn more about searching diagnostic logs.
I’ve found it helpful to use the following PowerShell scripts to control the monitoring of my applications. There are a small, but important set of parameters for these commands and you can read a bit more about them here.
|
Get-WebApplicationMonitoringStatus Start-WebApplicationMonitoring –Cloud “Default Web Site” –OutputPath outputfolder –Mode Trace Checkpoint-WebApplicationMonitoring // saves a log file Stop-WebApplicationMonitoring –Local -All |
Summary
This post was intended to make you aware of a couple of means of monitoring your application: built-in Azure monitoring and the more comprehensive Application Insights. It can often be difficult to know what data to log and pay attention to, but we hope that these options make that a little bit easier and less stressful.
One final note: Monitoring isn’t limited to production, but it should also be used in dev and QA environments. You may use slightly different settings, but you should be identifying problems before they get all the way to production. It also helps to get comfortable with these metrics while you are in development and not just at the stressful time of a production issue!
Additional Resources
Enabling Self-Service On-Demand Provisioning of Dev Environments
Check out other posts in this multi-author series by going here.
Development environments are a primary use case for using Azure today. As with production scenarios, the elastic nature of the cloud allows organizations to spin up computing power based on usage. If you only need a dev/test environment for a few minutes, then that’s all Azure will bill you for. In my experience though, Operations has been primarily focused on production – as they should be! Unfortunately, this means it can be challenging to find the resources needed to provision AND maintain development environments. On top of this, developers are being asked to dramatically increase their release cycles, so they may need to spin up and down numerous environments with very little advance notice to order hardware and then allocate time to provision and configure.
Enter Self-Service!! Azure gives your team the ability to stand up their own development and test environments. There are numerous ways to provision environments using Azure. In this post, I’ll detail the following options:
- Visual Studio Platform Images for MSDN Subscribers
- Visual Studio + Azure SDK
- Azure Management Portal
- Windows Azure Pack
Visual Studio Platform Images for MSDN Subscribers
In some cases, the only development environment you need is a machine running Visual Studio. Azure provides a gallery of virtual machine images with preinstalled software and it includes images with Visual Studio ready to go! (At the time I wrote this, these images were not available in the Azure preview portal [“Ibiza”] and were only available in the full Azure portal.)
Each Visual Studio image is tied to an MSDN subscription level. For example, as an Ultimate subscriber, I can provision a virtual machine preloaded with Visual Studio Ultimate since I own that license. (Selecting a version of Visual Studio that I am not licensed for can put my organization at risk of non-compliance!)
If you are a developer with Visual Studio Premium or Ultimate, then you are already Premium/Ultimate MSDN subscriber. If you are a QA person running Microsoft Test Manager, you are also an MSDN Premium subscriber.
Step 1: In Internet Explorer, navigate to the Microsoft Azure Management Portal (http://manage.windowsazure.com), click NEW in the bottom-left corner, select VIRTUAL MACHINE, and select FROM GALLERY.

Step 2: In the CREATE A VIRTUAL MACHINE wizard, select VISUAL STUDIO from the filter list, select the desired, and click the Next arrow. Be sure to select the image that corresponds to your MSDN Subscription level and the desired OS.

Step 3: On page 2, enter a unique name for your machine, select a tier/size, provide an administrator username/password, and click the Next arrow.
Step 4: On page 3, you can specify additional information about your virtual machine (DNS, subscription, region, endpoints, etc.). Click the Next arrow when you are finished.
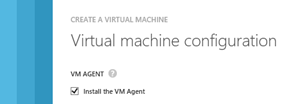
Step 5: On the final page, be sure to leave the Install the VM Agent checkbox checked. This agent allows us to remotely interact with the virtual machine. Click the Finish checkmark to start the provisioning process.
And, that’s it! Alternatively, you could provision one of these images using PowerShell. You now have a virtual machine with the following software pre-installed:
|
Windows Server 2012 |
Windows 7 |
Windows 8.1 |
|
| Visual Studio Professional, Premium, or Ultimate with Update 2 |
Yes |
Yes |
Yes |
| Windows Azure SDK for .NET 2.3 |
Yes |
Yes |
Yes |
| SQL Server 2012 SP1 Developer Edition |
Yes |
No |
No |
| SharePoint 2013 Trial |
Yes |
No |
No |
| Scripts to provision SharePoint 2013 and SQL Server |
Yes |
No |
No |
| Develop for Windows Store apps |
No |
No |
Yes |
| Develop for Windows Phone apps (coming later) |
No |
No |
No |
 USE CASE: I work on several, very different types of projects concurrently.
Most developers have just one development machine, but most developers are also working on several different projects at the same time. If your projects differ dramatically, then you can stand up any number of Visual Studio environments in Azure. Each of these environments can be configured for the specific technologies and configurations you need on a given project without worrying about “dirtying” up your machine for other projects. And because Visual Studio supports roaming settings, you can opt to sync your IDE preferences across these machines. Visual Studio and MSDN are licensed per user, so you only pay for the Azure usage.
 USE CASE: I’m a SharePoint developer.
In some ways, developing for SharePoint is much more challenging than developing traditional LOB applications. You either directly develop on Windows Server running on you host machine, develop locally and deploy/debug to a remote Windows Server, or develop on Windows Server running on a virtual machine. That last option is quite common, but it means your local machine needs an extravagant amount of resources on your local machine. With the pre-installed software and provided scripts on the Windows Server images, you can simply run some pre-installed PowerShell scripts to quickly stand up an environment ideal for SharePoint development. Included scripts let you set up SharePoint with or without Active Directory, setup a virtual network, provision a virtual machine for Active Directory, and joining to a domain.
 USE CASE: My machine isn’t always up-to-date.
In some organizations, it can be very challenging to keep developers up-to-date with both hardware and software. Development teams within an organization often make up a small percentage of the employee base, so it’s challenging to dedicate some portion of your desktop support staff to just this group’s specialized needs.
- Fast hardware: The tools, utilities, etc. often eat through resources like no other single machine in your organization, so Azure lets them scale the compute power for the needs at hand.
- Latest VS and other software: Many organizations keep a list of evaluated and approved software that can be installed on employee machines. Unfortunately, developers and IT Pro’s are often called on to work with unapproved or alpha/beta versions of tools, utilities, and libraries. It can be especially disappointing to be “stuck” on older versions of Visual Studio while trying to develop “tomorrow’s” applications for the organization. While it doesn’t eliminate the need to be a responsible employee, by moving your development environment to Azure, these power users can use these as yet unapproved tools in a relatively safe way.
- Admin access: Closely related to the last point, the somewhat isolated and potentially temporary nature of these cloud development environments means these users will have complete administrative access to these machines to install and configure the software as needed – a requirement to develop a lot of today’s modern applications.
Visual Studio + Azure SDK
One of the things we’ve been doing with the Visual Studio Azure Tools is to make the experience of working with cloud resources as seamless as working with your own local resources. Starting really with Azure SDK 2.2, we allowed to provision, debug, and shut down Azure resources without leaving Visual Studio.
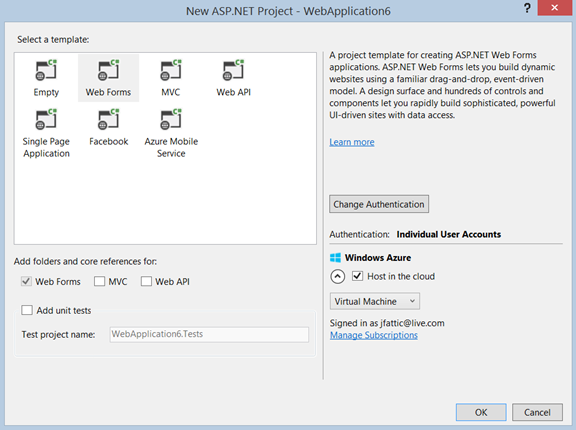
Step 1: In Visual Studio, create a new web project and click the OK button. (This only works for those projects based on ASP.NET Web Applications, so it won’t work for applications like WCF.)

Step 2: The New ASP.NET Project dialog appears. In the bottom-right corner check the box labeled Host in the cloud and select either Web Site or Virtual Machine from the dropdown list. (I’ve always been confused why this page is needed. It seem like this stuff could be in the project’s Properties page.)
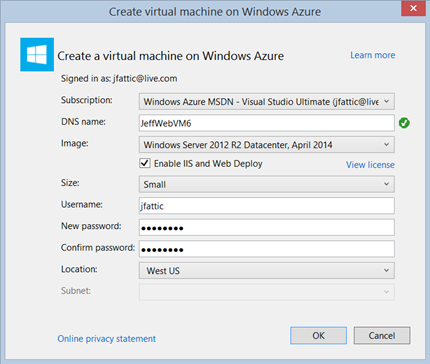
Step 3: If you elected to create a VM, the Create virtual machine on Windows Azure dialog appears. Provide the desired details like DNS name, VM image and size, and credentials. Click the OK button when you are ready.
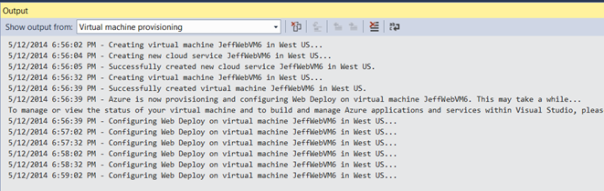
After you click OK, you can immediately start writing code. The virtual machine provisioning will start in the background and Azure will do most of the work. The Visual Studio Output window will appear so you can follow along with what’s happening.
 USE CASE: I develop ASP.NET web applications.
As you can see, if you are an ASP.NET web developer, we make it trivial to spin up an Azure Web Site or Virtual Machine to use as your development environment. You’ll still need to publish your app, but you’ll see we’ve already created the publish profile for your application.
If you are signed into Azure, the resource will appear in your Server Explorer under the appropriate Azure node. Amongst other actions, you can right-click it and select Enable Debugging. This enables remote debugging so you can run the web application in Azure and have it break into your local Visual Studio instance to see how it behaves.
 USE CASE: I don’t use Visual Studio, but I provision environments for applications.
If you aren’t a Visual Studio user, then provisioning your application environment from the IDE won’t really help you. Well, you’re in luck! When a developer creates a new Visual Studio web project and opts to provision an environment, we actually do this by generating and running a PowerShell script. That PS script file, along with a JSON configuration file are saved with the Visual Studio project. The project creator can make these files available to you so you can modify as you choose and run them yourself. It’s common for developers to initially provision an environment using their own MSDN subscription to take advantage of their monthly credits, but soon after, it makes sense to spin these environments up for use by others. While the developer could do this, they may not be owners of the organization’s Azure account.
Azure Management Portal
Unlike the previous options, you are likely already familiar with the Azure Management Portal – the web application that gives you access to create, configure, and shut down all of our Azure services. But, did you know you can do much of the same thing with PowerShell and there’s even a REST API for developers?
While the current version of the portal is very focused on IT Pro’s, we are hard at work on a newer version of the Azure portal that is committed to offering a better DevOps experience. It’s our belief that a successful DevOps collaboration starts by providing more transparency between the developers and operations sides of the house. Among other things, this new portal will make it easy for operations to send identified issues with actionable feedback to developers in Team Foundation Server and let them track these issues as they move through the development team.
 USE CASE: I’m not a developer.
The previous options are pretty obviously geared toward developers, but there are a lot of other people working on the technology solutions that run the modern business: business analysts, QA, product owners, and, of course, operations. People in these roles can use the management portal in their browser to check up on applications, networks, and other services. Whether you care about monitoring applications, managing billing, or configuring the wide variety of Azure services, the management portal is the one-stop shop.
 USE CASE: For more fine-grained control or visibility into my Azure resources.
While Visual Studio is hands-down the best developer environment in the world, it does not provide you with all of the capabilities present in the management portal, PowerShell, client libraries and the REST API. Don’t forget about these other tools!
PowerShell can be used to automate common or complex tasks of all kinds, but Azure provides a specific set of PowerShell commandlets that can help you do things like the following:
- Deploy Windows Azure VMs and load balance them
- Provision a Visual Studio Gallery image
- Start Windows Azure Virtual Machines on a schedule
Check out the Azure Script Center for more samples.
Sometimes, you need to integrate Azure management capabilities with your own applications. This is a brief description of many of what is provided by Azure’s web services.
| Service Management | Programmatically manage virtual machines, disks, SQL Azure, and cloud services |
| Azure Mobile Services | Query and alter backend data and authenticate with specific identity providers |
| Web Sites Management | Create and configure web sites; check status and usage |
| Storage Services | Programmatically access storage account, blob, queue, table, and file services |
| Azure AD Graph | Create, update, and delete users, groups, roles, and contacts |
| ACS Management | Engage the Access Control Service for claims-based authentication |
| Managing BizTalk | For BizTalk services, create, update, suspend/resume, or delete; create, delete, and list hybrid connections |
| Scheduler | Create, update, and delete scheduled jobs |
| Service Bus | Send and receive messages to or from the service |
By the way, if you think of a feature that would really help you, let us know at our feedback site.
Windows Azure Pack
Windows Azure Pack is a collection of the tools we use to provide our cloud-hosted experience, but packaged up for you to provide an analogous experience on top of your on-premises resources.
You can download the Windows Azure Pack for Windows Server here.
 USE CASE: I still have to manage some on-premises resources.
Wrap your on-premises resources with Windows Azure Pack to provide the following capabilities:
- A customizable self-service portal
- An administrative portal to manage user accounts and quotas
- A service management API for integration into other systems
- Virtual machine clouds for Windows and Linux IaaS
- Web site clouds for scalable web hosting
- Service bus clouds for reliable messaging
So, what goes where?
You should probably create some guidelines within your organization to define when you should use MSDN, when you should use your organization’s Azure subscription, and when you should use on-premises resources. Most organizations have policies on what kinds of data developers should have access to and how to access on-premises or third-party services for development. These same policies are a great starting point to define your organization’s policies on the use of Azure.
If your organization has already developed some policies on when to use Azure for dev/test, I’d love to hear about them. Every organization has a slightly different take on this, but I think there are probably some good, common practices.
Summary
I’ve tried to show you several options for setting up your development environment. But this is not the end of the road, we have a lot more ideas we’ll be rolling out in the next few months and for years to come. The idea of DevOps is not a new one, but no other company is better able to help you deliver on it than Microsoft!
Putting Technology In Everyone’s Hands
This is the first in a series of blog posts I’m going to write about some cool things Microsoft is doing around education.
We all know about the box-top redemptions and various fund-raising exercises that schools use today. If you’re like me though, you may find these things frustrating because you have no way of knowing how much money this actually raises for the school or how that money is spent. Just by using Bing as your search engine, you’ll earn reward points that can be exchanged for all kinds of things, but one option is to contribute towards getting tablets for schools.
You need to sign up for Bing Rewards with either a Microsoft account or a Facebook account. You can then donate your reward points to your school. Once your school has accumulated 30,000 points, they get a Surface RT tablet! These aren’t just toy tablets, but tablets that provide the number one productivity suite – Microsoft Office. You are no longer tied to your desktop to write papers and build presentations.
You get a point for every 3 Bing searches, but there are also daily opportunities to earn more points by learning more about Bing and other topics on the internet.

Getting 30,000 points may seem intimidating, but teamwork counts here. Let’s do some arithmetic. Even though you can get points other ways, the majority of your points will probably come from searches, let’s just focus on that. You are limited to 30 points a day for searches, so…
30,000 points / 30 points per day = 1,000 days. That means you’d have to search every day for three years before you got one tablet!
But there are hundreds of kids in most schools and approximately double as many parents! So, if one classroom has approximately 25 kids, then you also have approximately 50 parents.
50 people * 30 points per day * 20 days = 30,000 points! That’s a free tablet in just 20 days!
If those same people continue for one year…
50 people *30 points per day * 365 days = 547,500 points OR 18 Surface tablets! We almost have enough for the whole class!
Oh, and by the way, you get 200 credits for every friend you invite to Bing! So, don’t just tell people about the program – invite them to it!
Learn more about Bing Rewards. You can order free posters and flyer here as well.
Options for Copying Test Cases in TFS
I recently had a customer ask if they could “copy” test cases in Microsoft Test Manager. As with many questions, the answer is the all too fearsome, “it depends” and more context is needed to properly answer the question. In this post, I thought I’d try to describe the options for “copying” test cases and provide some sample use cases.
Re-using a test case
Within a test plan, you can place the same test case in multiple test suites. These “copies” are the same test case and any changes you make to this test case will be evident no matter which test suite you open or run it from.
Copying a test case – This is also known as a “shallow copy”
You can copy test cases from one test plan to another. When copying test cases, you create a copy of all test cases in one test suite and add them to another test suite. As with the above option, these are really the same test cases, so any change you make to one, you will make to the other. The attributes and test steps are all “shared”, however test results are not.
Note that the source and destination test suites are independent of each other. You can add or remove test cases from either of them without affecting the other.
How-To:
- From the Plan tab, select a static test suite that will hold the new copy.
- In the toolbar, click the button Create test suites by referencing existing test cases.
- In the dialog window, select the test plan and test suite that you want to copy, and click Create suite.
Use Case:
- When you are beginning a new iteration or project, you may want re-use existing test cases from previous efforts.
Cloning a test case – This is sometimes known as a “deep copy”
You can clone test cases to create an independent copy of an existing test case. After cloning, you can make changes to either the original or cloned test case without affecting the other.
Note that cloning can be used across Team Projects, but not across Team Project Collections.
Note that this creates a whole new test plan.
How-To:
- From the Organize tab, select a test plan.
- In the toolbar, click the button labeled Clone.
- In the dialog window, select one or more test suites from the drop down list that you want to clone.
- (Optional) Check the box labeled Clone requirements to also “deep copy” any requirements associated with the selected test suite(s).
- On the right side of the dialog, enter the name of the destination test plan, and set the associated area path and iteration path.
- Click the Clone button.
- The Clone log appears. Pay close attention to the status of each cloning operation as it may take a few moments to complete.
OR
- Open a command prompt.
- Type cd %VS110COMNTOOLS%..\IDE to navigate to the necessary directory
-
Type tcm suites /clone /collection:http://YourServer:8080/tfs/YourCollection /teamproject:”YourSourceProject” /destinationTeamProject:”YourDestinationProject” /suiteid:YourSourceSuite /destinationsuiteid:YourDestinationSuite /clonerequirements /overridefield:”YourField“=”YourValue“
- YouServer– the name of your Team Foundation Server
- YourCollection– the name of your Team Project Collection
- YourSourceProject– the name of the Team Project you want to clone from
- YourDestinationProject – the name of the Team Project you want to clone to; this is an optional parameter and you do not need to use it if you are cloning within the same Team Project
- YourSourceSuite – the ID of the test suite to be cloned; the ID is displayed in the details pane when you select it in the test plan; retrieve a list of suites by using tcm /suites /list; nested test suites will be cloned as well
- YourDestinationSuite – the ID of the test suite you want to clone to
- *clonerequirements – this is an optional parameter and you use it if you want to clone the requirement work items used by requirements-based suites; if this parameter is not specified, requirements-based suites will be converted to static suites
- *overridefield – this is an optional parameter and you use it if you want to set a particular field in the new test cases
Use Case:
- Clone test cases when you want to use the same test case against two releases simultaneously. This way you can edit the test case for one release without interfering with the efforts in the other release.
Use a test case as a template to create a new test case
You can use an existing test case to create a new test case with all of the same values.
How-To:
- From the Plan tab, right-click a test case, and select Create copy and add to suite.
Use Case:
- When you have a number of test case properties (e.g. iteration path, area path, priority, etc.) that will have the same values in your new test case, you can use an existing test case as the starting point.
- Similarly, when you have a complicated or lengthy number of test steps in an existing test case that will be repeated in a new test case. (You should also consider Shared Steps in this use case.)
There’s a growing number of Microsoft Test Manager/TFS users out there, so I hope this helps you.
Visual Studio 2013 Preview Event
I just wanted to thank my co-presenter, Chris Kadel, and everyone who attended the event in St. Louis. (We had a broad range of new features to present on and there just never seems to be enough time to get to everything.)
I didn’t have any slides, but Chris did and you can find those here.
For those that weren’t able to attend, here’s a breakdown of features we covered:
- Managing SCRUM of SCRUMs (agile portfolio management)
- Improved offline version control option with Git
- New collaboration options (Team Rooms and web-based code commenting)
- IDE enhancements to improve productivity
- New insights into code (CodeLens)
- Simplifying performance analysis (Performance & Diagnostics Hub)
- New performance tools (Energy Consumption & UI Responsiveness)
- Productivity for C++ developers w/ new language/tooling support
- “De-fragging” ASP.NET
- Cloud-based load testing
- Simplified Team Build
- Integrated release management (InRelease)
- New ways to reproduce production issues (new version of IntelliTrace collector and memory dump analysis)
Look forward to future events around Visual Studio and TFS 2013. I’ve seen a glimpse of other features that may be included for RTM/Update 1 and I think you will love it!
Xbox Music Now Available Everywhere Else
The absolute best value in music is now available wherever you need it to be!
Microsoft now allows you to access your Xbox Music from any browser. The site looks almost exactly like the new Windows Store version. (I don’t know when I would use the web version myself as I will no doubt continue to use Xbox Music on my PCs, Xbox, and HTC phone.)

Like I’ve said before, the Xbox Music Pass is the really great deal here. For $9.99 a month or $99.90 a year, you get unlimited access to the entire Xbox music library. You can get a 30 day free trial at http://music.xbox.com.
Do you have an Xbox Music Pass? What features would you like to see added to Xbox Music?
Visual Studio 2013 Preview – User Account
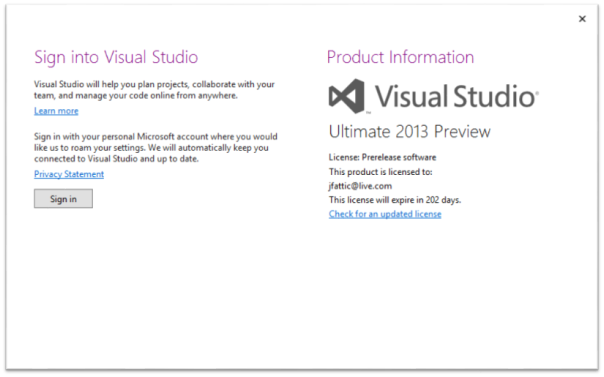
New to Visual Studio 2013 is the concept of a user account.
When you first run Visual Studio, you will be prompted to sign in. We will use this information to store your settings in the cloud and make them available to you on whatever machine you are using.
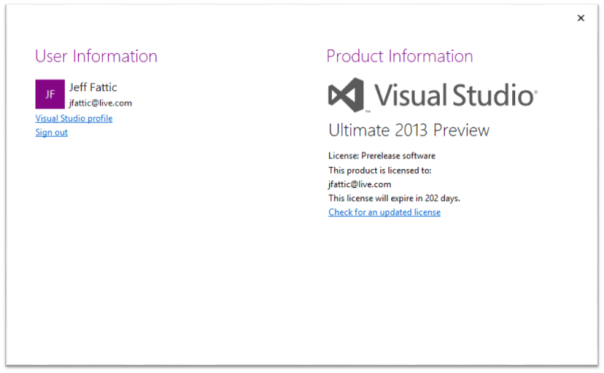
You can always view your account information by going to File | Account Settings…
If you click the Visual Studio profile hyperlink, you’ll be navigated to the following page in your browser.
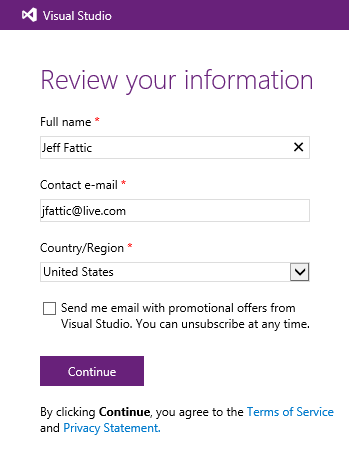
After reviewing your profile information, click Continue. This will just take you the Team Foundation Service site.
This user profile feature is still early, but I can foresee a lot of potential here beyond tracking your settings. Down the road, we could…
…add more features to the associated web site that show you news you follow like blogs, Channel 9 videos of interest, events you may want to attend, etc.,
…track your recent activity and activity of your team(s) in a dashboard,
…use your stored credentials to auto-connect you to databases, servers, Azure, and more;
…alert you to activity wherever you are – such as NuGet Package updates.
Where would you like to see us go with this?
Visual Studio 2013 Preview – Team Explorer Home Page
While Team Explorer 2012 (and subsequent Updates) added some really great features, I’m really happy to see the new user experience in Visual Studio 2013 Preview.
The new Home page
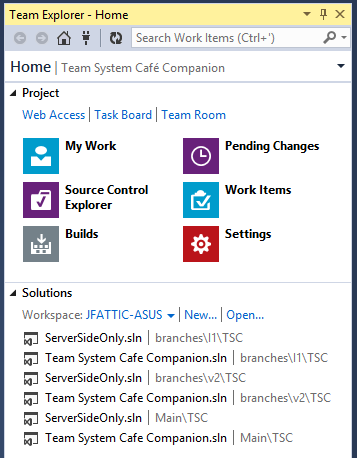
Project group
At the top of the Home page, the Project section shows the same hub links, but is both more concise and colorful. You can more easily dock team Explorer to a small pane or on your second monitor in a very small space. The color adds some aesthetic appeal, but it also helps your eye gravitate to the color/symbol faster than reading text.
With 2013, each option is more than a navigation link. You can right-click each to see a context menu of related commands. Right now, the context menus are very sparse, but I could see additional options being added over time. In 2012, there is a Request Code Review link under the My Work link. In 2013, the Request Code Review command is available by right-clicking My Work.
Right-click Pending Changes gives you the option to Find
Shelvesets.
Right-click Work Items to create a New Query.
Source Control Explorer is now its own item – rather than under Pending Changes as it is in 2012.
I love that you can navigate straight to the active Task Board for this Team Project and I’ll explore that and the new Team Room feature more in another post.
Solutions group
Below the Project menu is a list of solutions pulled from the active Team Project and your workspace. My favorite part of this is subtle – when you open a solution from this list, it bolds the text. I can just glance at it to see which solution and its branch. For those of you that regularly move between workspaces, you can switch them in the drop-down list provided. The New… and Open… hyperlinks create/open Visual Studio projects respectively – not workspaces as one might think.
That’s all for now. I’d love to hear what you guys think. If you have suggestions for the product team, contribute to User Voice. (They really do listen to that feedback. I know because I see the summary reports the team sends out.)
TFS 2012 Fun!
http://www.youtube.com/watch?v=p9TDkP4xGpU
This is a fun video. The lyrics are really funny!
